
AI Analytics
Site activity index calculated with AI from the cameras: presence of people, machinery and vehicles, with 24-hour, monthly and six-month summaries (beta).
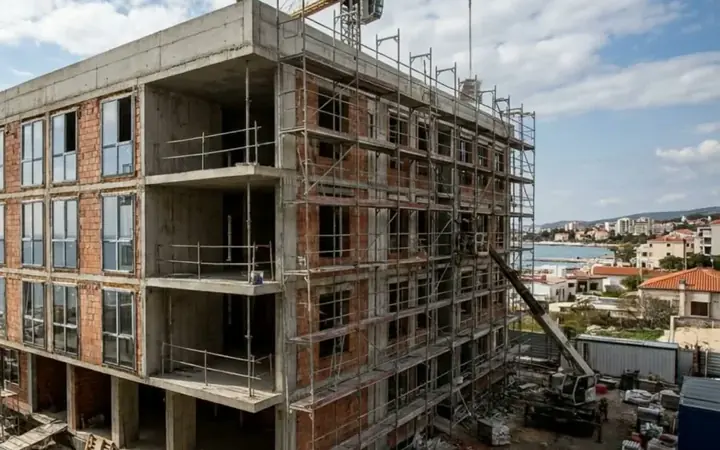
Site managers and senior management see every site live, review what happened at any moment and document each phase.
AI-generated images
Site activity index calculated with AI from the cameras: presence of people, machinery and vehicles, with 24-hour, monthly and six-month summaries (beta).
A comprehensive, accurate, and practical overview of the weather conditions affecting your construction projects.
Import or build the project Gantt chart and compare it with what the cameras show and the weather forecast.
For a contractor, VisionHub is a way to supervise several sites remotely and document every phase. The site manager watches the 24/7 live view, reviews up to 30 days of recording when there is an incident and checks an AI-calculated activity index that shows whether the site is active.
Free base plan. Live view, continuous recording, AI analytics and 4G camera rental are added by module, each with a monthly fee; check the current price in the pricing calculator.
Supervising several sites without travelling, reviewing up to 30 days of HD recording after an incident and logging weather conditions with images to justify delays.
No. It detects presence and movement to calculate an activity index, with face blurring and statistical data not linked to individuals, in line with the GDPR.
The VisionHub Gantt chart imports your schedule in XML format or can be built from scratch, and is viewed alongside the live cameras.
Book a demo and review a live site with us.