Marsel Spire39%ActiveDubai, UAE
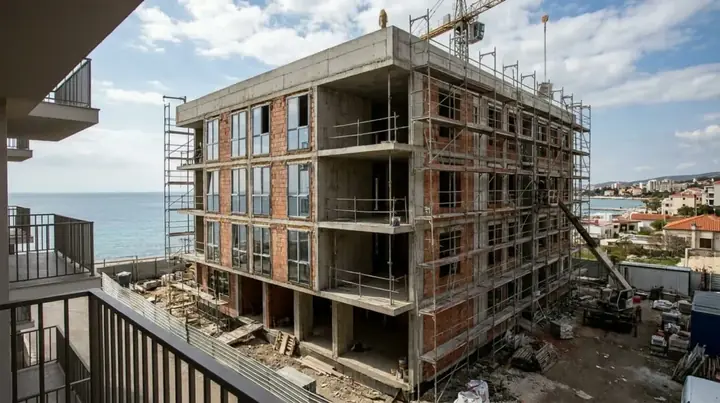
Import or build the project Gantt chart and compare it with what the cameras show and the weather forecast.
Clear, visual, and structured overview of all project tasks. View dates, assigned team members, dependencies, and progress within a single intuitive dashboard.
See which tasks are slipping before they affect handover.
Tasks, owners and dates in a single panel.
The Gantt next to the live cameras and the weather forecast.
1. Import or create your Gantt chart (XML upload or from scratch).
2. Visualize the complete project schedule.
3. Plan tasks and define dependencies (parent tasks, subtasks).
4. Update and modify tasks in real time.
5. View the Gantt chart alongside live construction cameras.
6. Compare with the weather forecast.
Upload the XML from your planning software or start from scratch.
Tasks, subtasks and dependencies across the full schedule.
Change tasks in real time and compare them with the live view and the weather.
See it on a real project
Book a demo, or leave your details and we will call you. Work out the price for your project